
A brief for policymakers, farmers and other citizens
Based on research by Colin Whitfield (School of Environment and Sustainability, University of Saskatchewan, Saskatoon, SK), Sydney Jensen (Department of Biology, University of Regina, Regina, SK), Lauren E. Bortolottia (School of Environment and Sustainability, University of Saskatchewan, Saskatoon, SK, Institute for Wetland and Waterfowl Research, DucksUnlimited Canada, Stonewall, MB), Darrin Qualman (National Farmers Union, Saskatoon, SK), Murray Hidlebaugh (National Farmers Union, Saskatoon, SK), Scott Beaton (National Farmers Union, Rosser, MB), and Kerri Finlay (Department of Biology, University of Regina, Regina, SK; Institute of Environmental Change and Society, University of Regina, Regina, SK)
Email: darrinq@sasktel.net or kerri.finlay@uregina.ca
The authors of this policy brief acknowledge the generous support of the Ivey Foundation.
Background to this Document
This policy brief is derived from the following peer-reviewed journal article: C. Whitfield, S. Jensen, L.E.
Bortolotti, D. Qualman, M. Hidlebaugh, S. Beaton, and K. Finlay, “Wetland Drainage Produces Substantial
Greenhouse Gas Emissions in the Canadian Prairie Pothole Region,” FACETS 10 (December, 2025), https://
doi.org/10.1139/facets-2025-0124 OR https://www.facetsjournal.com/doi/10.1139/facets-2025-0124
For additional details, sources, discussion of methodologies, etc. please see that article.
Key Findings
No one has previously quantified greenhouse gas (GHG) emissions from wetlands drainage in the Canadian Prairie agricultural area. Our study finds that, each year, on average, wetland drainage on Prairie farmland releases 3.4 million tonnes of carbon dioxide equivalent (CO2e). This amount is significant: equal to about 8 percent of Prairie agricultural emissions. Currently, emissions from wetlands destruction are not included in Canada’s official GHG numbers: the National Inventory Report (NIR). Remedying that omission can be an important step toward raising the profile of this issue, thereby contributing to slowing the destruction of wetlands and creating numerous other environmental benefits.
In the farmland area of Canada’s Prairies, wetlands are being drained or otherwise destroyed at a rate averaging 10,820 hectares (26,737 acres) per year (for detailed sources and citations as well as for uncertainty estimates for all terms, please see the journal article). Destroying wetlands has multiple negative impacts for water retention and management, flood mitigation, groundwater recharge, surface water quality, wildlife habitat and biodiversity, and GHG emissions and climate change. This analysis focuses on GHG emissions.
Wetland soils store large amounts of carbon. When wetlands are drained and cropped, much of that carbon is lost to the atmosphere—converted to carbon dioxide (CO2) by organisms that consume and “respire” the carbon. Studies show that undrained Prairie wetland soils contain, on average, carbon equivalent to more than 600 tonnes of CO2 per hectare, but the surrounding farmland contains carbon equivalent to just over 300 tonnes of CO2 per hectare—a difference equivalent to 316 tonnes of CO2 per hectare (1). Our study assumes that, once dried and farmed, carbon levels in former wetlands will decline to match surrounding soils.
Multiplying these two numbers together—10,820 hectares per year and 316 tonnes of carbon dioxide per hectare—comes close to the figure above: 3.4 million tonnes CO2e released from one year’s wetlands drainage. But our calculations are more comprehensive, considering additional factors, including post-drainage emissions produced by farming and fertilizing the former wetland; carbon released from removal of above-ground vegetation (e.g., burning willow rings); and emissions avoided by no longer overlapping around wetlands during seeding.
Note that our research also calculated a lower value: 2.1 million tonnes CO2e resulting from one year’s worth of wetlands drainage. That figure takes into account natural emissions from intact wetlands—mostly methane (CH4). But GHG accounting protocols, including those of the UN IPCC and Canada’s official National Inventory Report (NIR), exclude natural sources (e.g., emissions from natural decomposition in forests or swamps) and count only human-caused (“anthropogenic”) emissions. For example, emissions from cows are counted but those from deer are not. For these reasons, the value most relevant to calculating emissions from wetlands destruction is the higher, 3.4 million tonnes, number (which excludes natural GHG emissions).
Policy Recommendations
Emissions of 3.4 million tonnes CO2e from one year’s worth of drainage is significant—larger than many agricultural emissions sources currently included in Canada’s NIR (e.g., agricultural emissions from gasoline combustion in trucks or from poultry and swine manure). In another context, 3.4 million tonnes CO2e annually is equal to a large fraction of current cropland soil carbon sequestration on the Prairies. Farmers here are officially counting 15–20 million tonnes annually of very positive soil carbon sequestration (largely from reduced tillage), but 3.4 million tonnes per year of emissions (a form of desequestration) goes uncounted, and partly offsets the positive contribution that sequestration can provide. (Emissions/desequestration from the loss of trees on agricultural land is similarly uncounted.)
Adding emissions from wetlands destruction to the NIR will give a more accurate picture of total agricultural emissions and it will, thus, also support efforts to slow wetlands destruction, creating many attendant benefits in the forms of wildlife habitat, groundwater recharge, and flood mitigation. By better understanding the emissions costs of wetlands destruction we can increase support for their protection and retention.
We recommend that:
- Building on the findings summarized here and detailed in the FACETS article, governments should add emissions from wetlands drainage to Canada’s NIR; and
- Acknowledging the shared jurisdiction, federal and provincial governments should cooperate to increase incentives for wetlands retention and develop disincentives for destruction.
Additional Details on the 3.4 Million Tonne Number
The preceding focuses on two factors in the equation for determining GHG emissions from wetlands destruction: the rate of wetlands loss (10,820 hectares per year); and the amount of emissions from wetlands soils (316 tonnes CO2 per hectare). Multiplying the first number times the second yields a result close to 3.4 million tonnes CO2e per year. The equation actually used, however, is more comprehensive, with four additional terms. See Table 1.
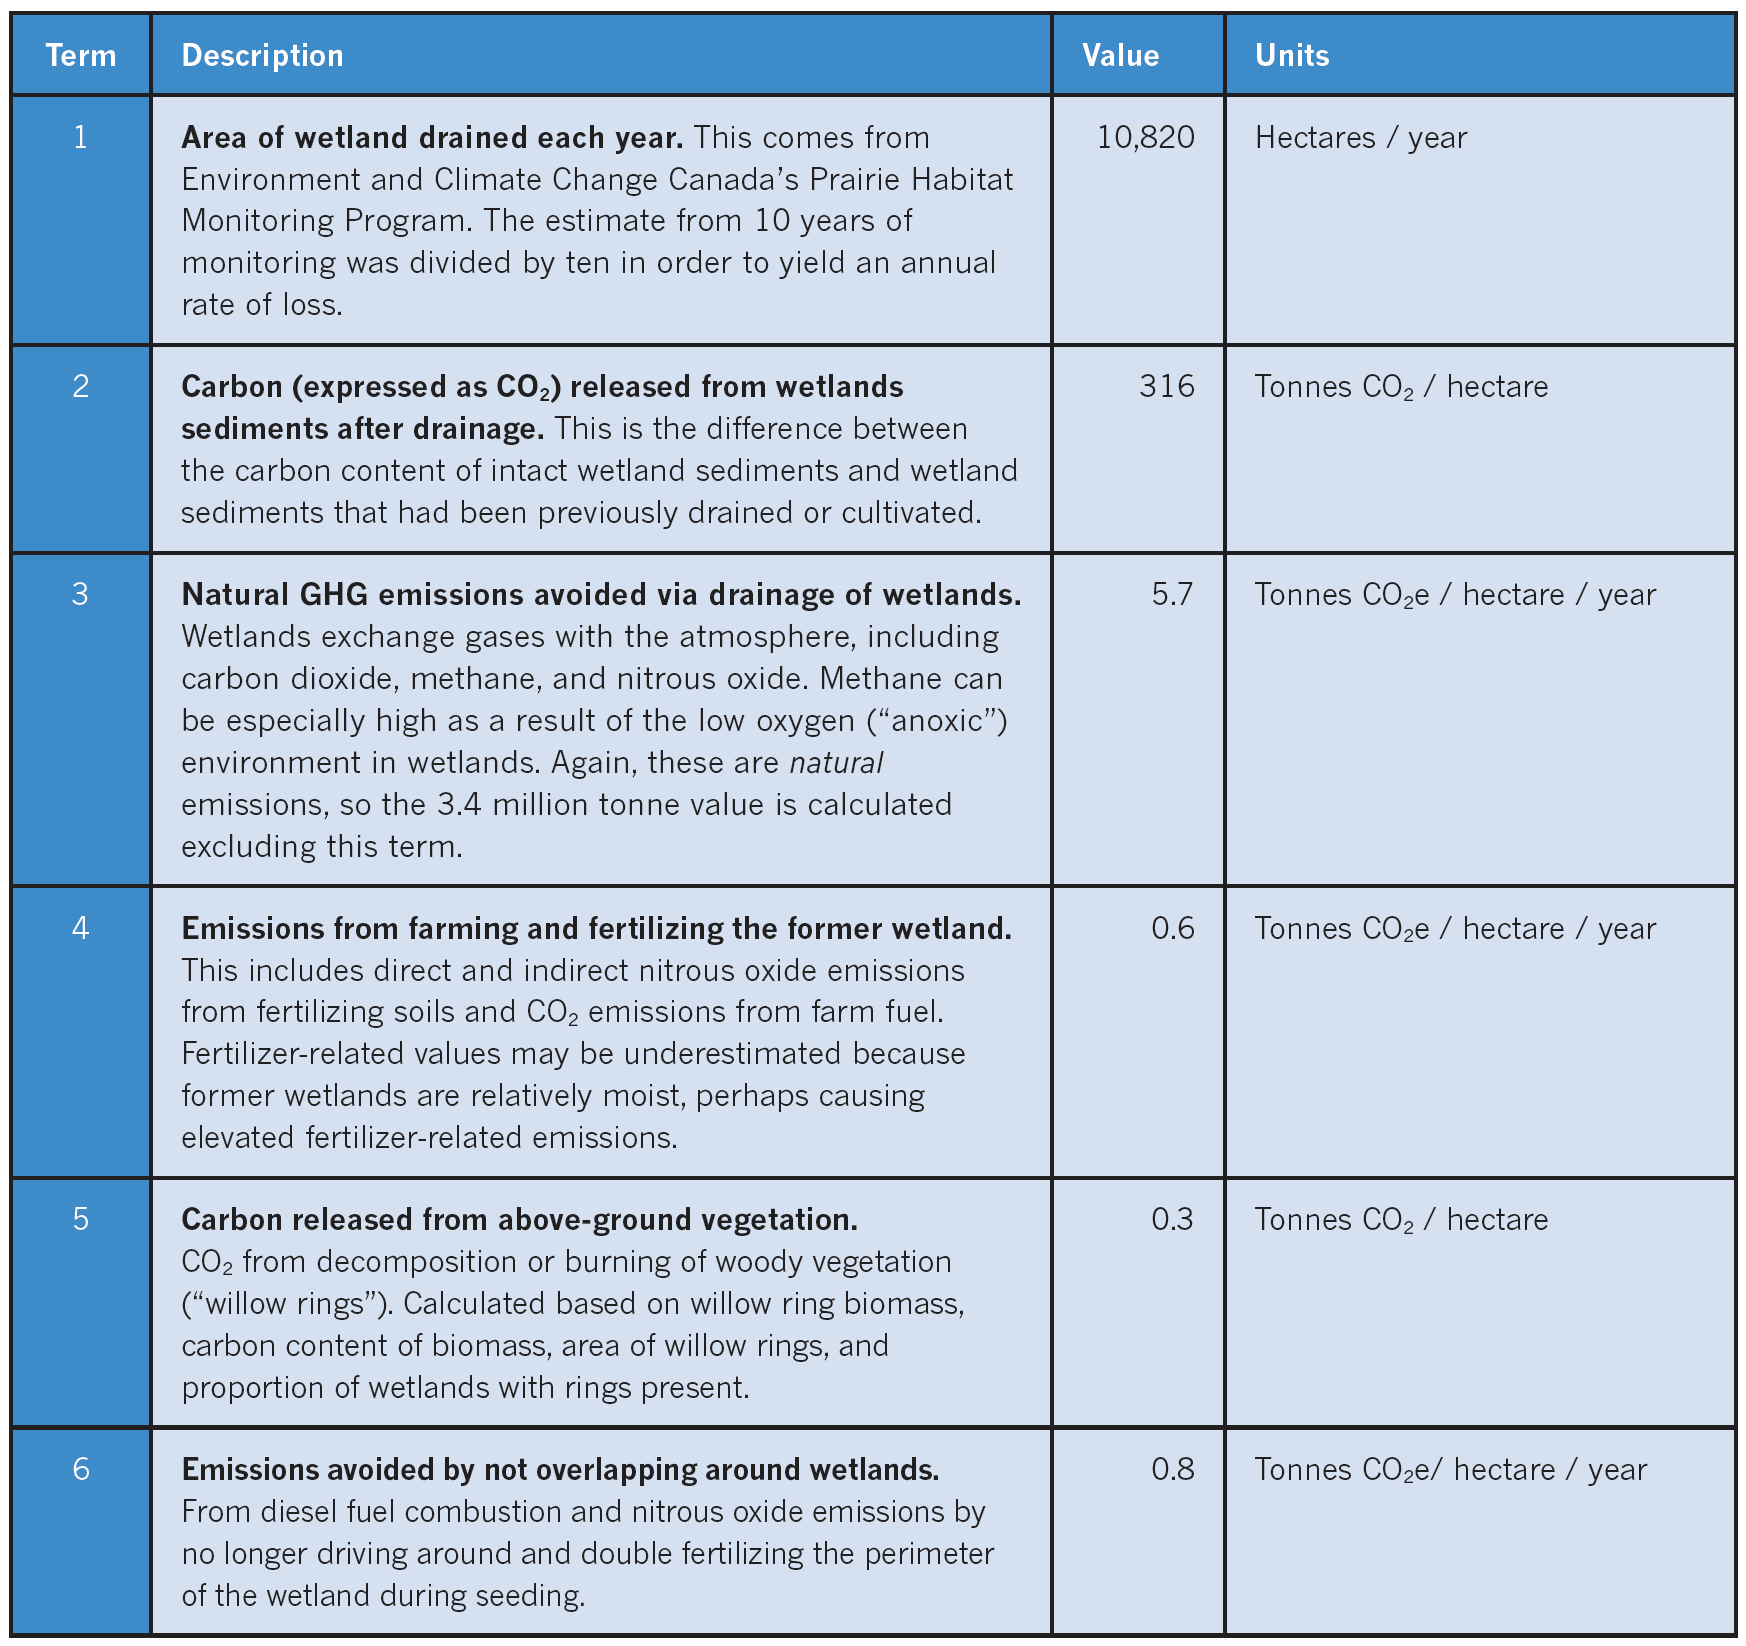
Table 1. Six main terms, units, and values used to calculate the net GHG emissions associated with wetland drainage in the Canadian Prairies.
Equations and Calculations
The following equation relates the six terms and shows how total emissions from the destruction of wetlands were calculated:
Total emissions =
T1 x (T2+T5)
+ T1 x (T4 x 20 years)
– T1 x ((T3 + T6) x 20 years)
Note that in the equation, T1 is multiplied by the sum of T2 and T5, as these are one-time losses. Terms 3, 4, and 6 are all multiplied by 20 as they represent annual rates that will continue over the 20-year time frame expected for wetland sediment to equilibrate with the surrounding upland SOC. T4 is added to the total, as this represents an additional GHG emission resulting from wetland loss. T3 and T6 represent emissions that are avoided as a result of wetland drainage and thus are subtracted from the total. While T3 is included in this equation, for clarity, as it represents natural emissions, T3 is excluded in calculating the value of 3.4 million tonnes per year, mirroring IPCC and NIR conventions.
Substituting in descriptive terms, we get:
Total emissions =
Area drained x (carbon released from wetlands soil as CO2 + carbon released from willow rings as CO2)
+ Area drained x (emissions produced from farming and fertilizing the former wetland x 20 years)
– Area drained x ((emissions terminated by drainage + emissions avoided by ending overlap) x 20 years)
Figure 1, beside, depicts graphically the terms used to calculate overall emissions and the magnitude of those terms.
The top panel represents emissions associated with intact wetlands. The bottom panel represents the emissions occurring when wetlands are drained and cropped.
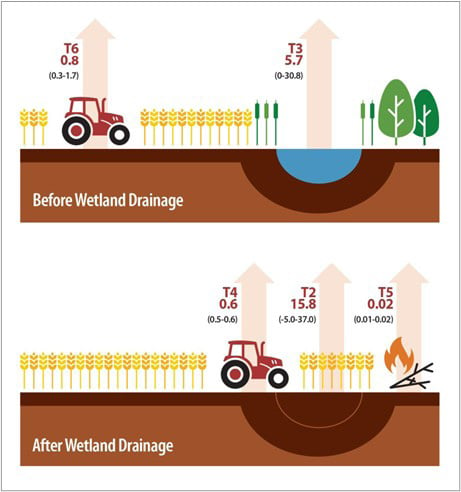
Figure 1. Conceptual diagram of the terms used to calculate emissions, omitting T1 (area of wetlands drained). All numbers are in Mg CO2-eq ha−1 year−1.
T2=Carbon (expressed as CO2) released from wetlands sediments after drainage.
T3=Natural GHG emissions (including carbon dioxide, methane, and nitrous oxide) avoided via drainage of wetlands.
T4=Emissions from farming and fertilizing the former wetland.
T5=Carbon released from destruction of above-ground vegetation, i.e. “willow rings.”
T6=Emissions (from fuel and fertilizer) avoided by not overlapping around wetlands.
(1) For consistency with national and international reporting norms, CH4 and N2O were converted to CO2e using 100-year global warming potentials of 28 and 265, respectively. Also note that a quantity of carbon can be equated to carbon dioxide by multiplying the former by 3.67. Going from CO2 to C, you divide by the same factor.
